

There are a lot of blog posts around metrics, so why another one? To provide a concrete case study of setting up KPIs for a B2B SaaS.
Throughout this post we’ll consider a fictional video sharing SaaS the lets its enterprise customers host videos from internal meetings like Tech Talks, All Hands, etc so employees of that enterprise can easily find and view internal content. The metrics presented here are based on the Pirate Metrics and Actionable Metrics frameworks. We’ll look at the following metrics keeping in mind to have per-user metrics and grouping users in cohorts where applicable.
Acquisition: Measures how users find us. These are usually provided by good CRM solutions and track users’ journey until they sign up for our service.
Activation: Measures whether users have a great first experience. This forces us to think about the user activities that will lead them to have an “aha” moment about the value we provide.
Retention: Measures whether users come back. This is most important for ongoing businesses and measures user activities from the time they realized our value (got activated), to the time they will eventually churn.
Referral: Measures if users tell others about us.
Revenue: Measures how we make money. This is very business specific and in our B2B SaaS it revolves around a subscription model.
Acquisition
This set of metrics are around tracking which of our many sales channels is the best performing. There are three metrics that track performance — Customer Acquisition Cost (CAC), Volumes, and Conversions.
Customer Acquisition Cost
These are fairly straightforward to define. Let’s say we are tracking two sales channels, online ads and cold calling. For cold calling we use a 3rd party cold calling service. We decided that we want to look at weekly numbers; daily would’ve been too granular and noisy, monthly would have smoothed over patterns we’d like to analyze.
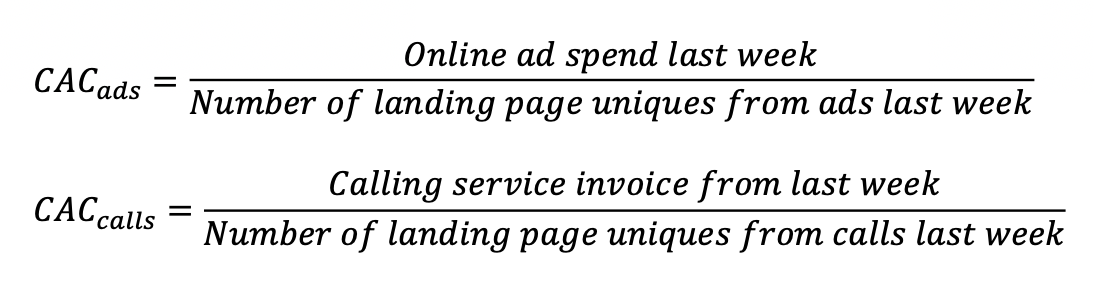
It would also be good to get a moving average of both these metrics over a 52 week period so we can look for seasonal variations.

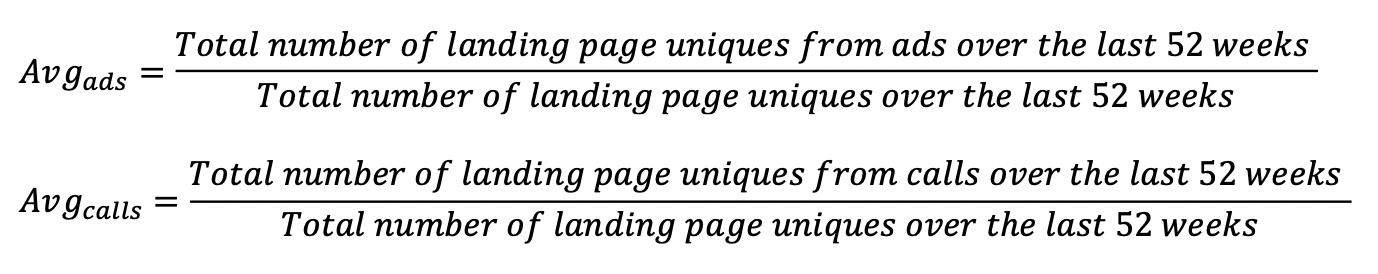
Volume
The amount of traffic generated by each sales channel. As before we’ll track the weekly numbers as well as a yearly moving average.

Conversions
We first need to define what our sales pipeline looks like. This is usually a customer’s journey from being a visitor to our website, to being a lead, to being a qualified lead, and finally becoming a customer. Of course a real sales pipeline is never this linear, it probably looks more like a directed cyclic graph. But that is fine. To speak in Computer Science terms — we want to measure the transition probabilities of going from one node in our graph to another. Let’s say we offer two CTAs (Call-To-Action) to visitors on our website — download our white paper, or sign up for a 30 day trial — no credit card required! We want to know how many visitors go straight to the sign up page and how many get there via the white paper download. The metrics we want to measure are -
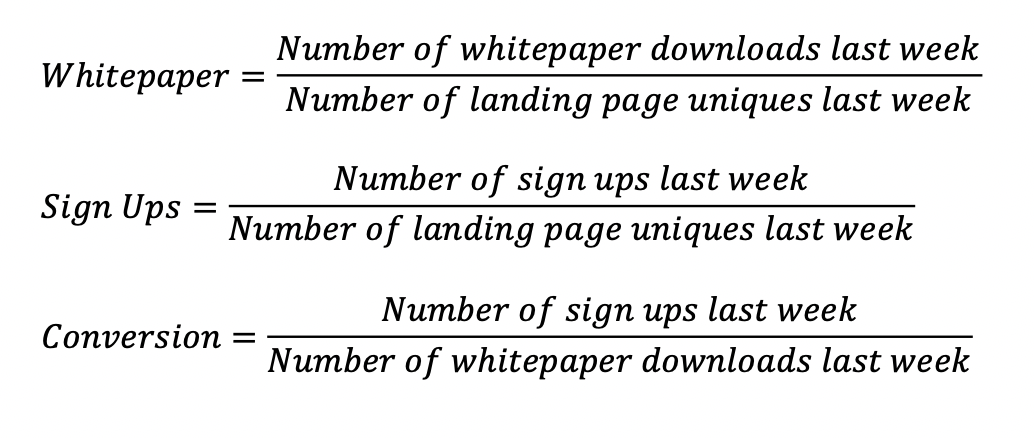
We can go crazy and measure the conversion of each stage in our pipeline, but usually that leads to information overload. We want to measure a few strategic conversions.
Activation
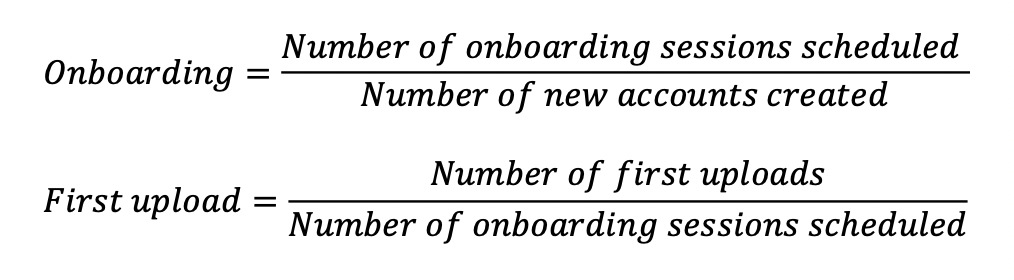
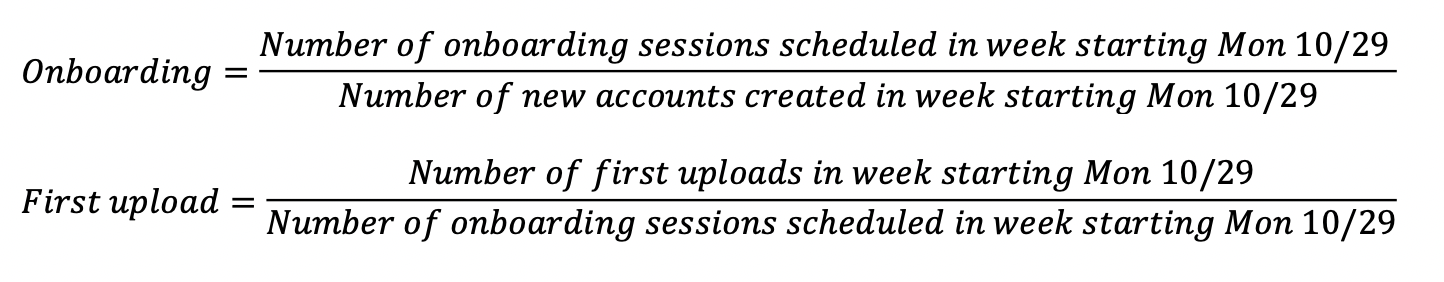
Even after a user signs up for our trial service, they may end up never using it. Or they start to use it but stop mid-way. First we need to decide what steps will lead users to the “aha” moment where they realize our value. For Dropbox it was when a user uploaded a file, for Twitter it was when a user followed 30 people, etc. Let’s say we have that figured out, and for us it is when the user schedules an on-boarding session followed by uploading their first video. A first draft of these metrics looks like -
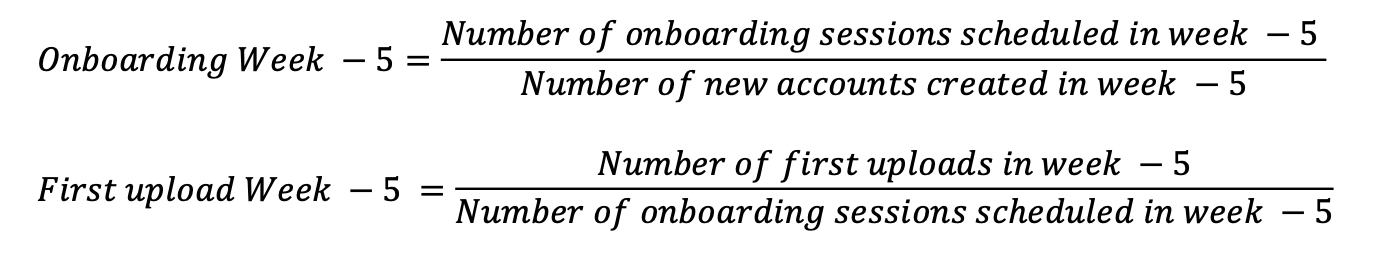
One option is to do this on a weekly basis like we did for Acquisition metrics. But then a user who signed up 3 weeks ago and is only now scheduling an on-boarding session is being counted against the new account that got created last week. To avoid that, we can group our users by the week they signed up in. Our second draft looks like this -
But now how far back in the past do we go? Do we go as far as last year, last two years? For that we need another piece of data — let’s say we have observed that 90% of our users do these two activities in the first 7 weeks of signing up. So we only want to track users from Week -7 to Week -1, i.e., the last week.
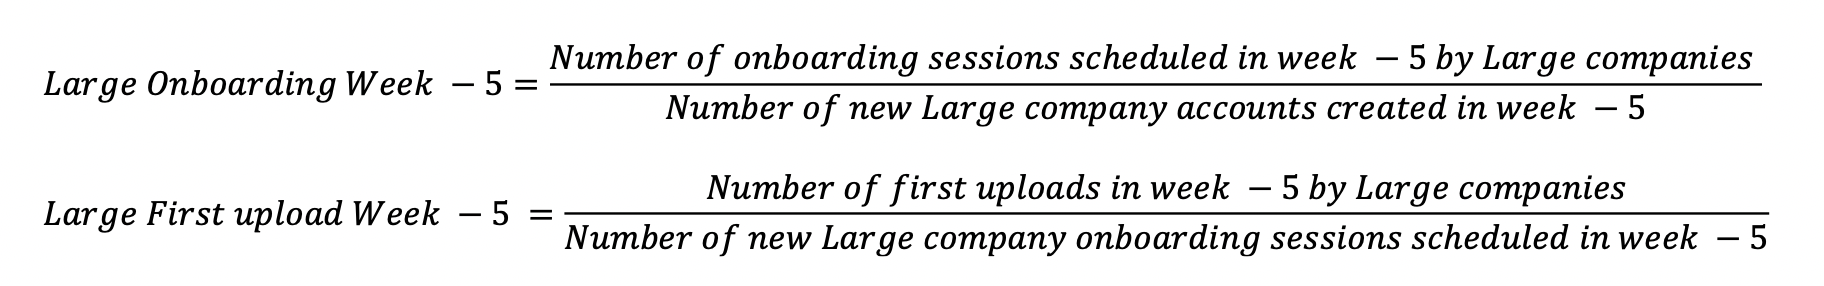
We can decide to stop here, but we have also noticed that large companies behave differently from smaller companies. For us — it makes sense to further group our customers by the number of employees — let’s say Large, Medium, and Small. In our fourth and final draft, we’ll further split each of the above metrics into 3. Here is what it will look like for Large companies from Week -5.
Retention and Churn
By far the most important metric for ongoing businesses. Typically in a SaaS there are two types of users — the ones that pay for the service — call them account managers, and the ones that use it — call them users. In our business, our users are further divided into users who create content, and users who consume it. We want to encourage the content creators to upload more new content which will draw more content consumers and overall we’ll be able to demonstrate the value provided by our service to the account managers. The user divisions lend themselves naturally to newer cohorts, and as before we’ll measure things on a per-user basis. Of course, we’ll continue using our Large/Medium/Small cohorts.

As in the Activation metrics, we have a choice of whether we want to simply track this weekly, or get better attribution by tracking content created in a specific week against unique views in that week. In our case, because the content is generally quite long-lived, we are ok with the simple model of tracking it weekly.
The ultimate retention metric is the number of subscriptions that are renewed.
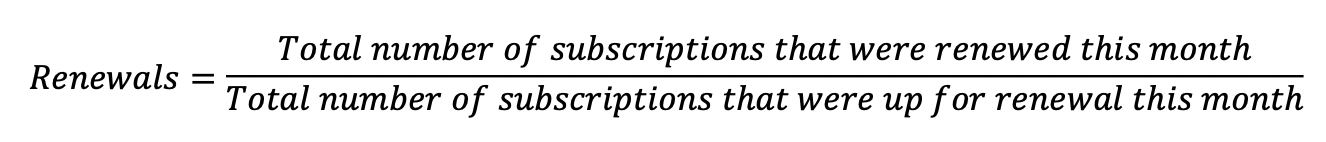
For this particular retention metric we also want to track its evil twin — the churn metric. It is simply 1 — renewals. We want to keep our churn metric pretty low, otherwise it will indicate that we are losing customers faster than we are acquiring them.
Referrals
In our business there are two types of referrals. First is whether the account manager of one enterprise will refer us to their counterpart in some other company. Second, within the company, will the users refer us to their colleagues who are not yet using our service.
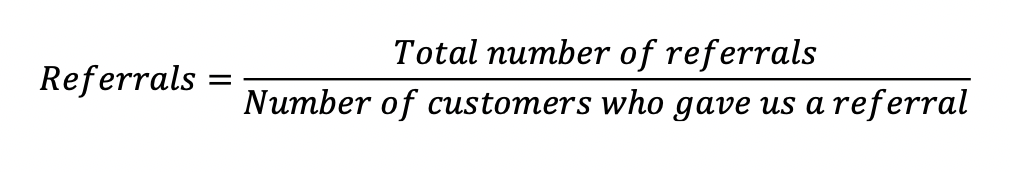
In order to measure whether an account manager will refer us, we can use a technique called a Net Promoter Score, which is a qualitative measure calculated through a survey. A more direct way is to ask our customers for referrals and measure how many referrals we get per existing customer.
Initially we can measure this since our company began operations. But gradually we will go as far back as a couple of years.
In order to measure the second type of referrals, the ones within a customer organization, we will use the Viral Coefficient. This measures the number of times a user clicked on the “share” button on the video and shared it with a colleague. A viral coefficient greater than 1 is really good and it gets exponentially better. A viral coefficient less than 1 on the other hand needs attention.

If we are tracking conversion between receiving a shared link and actually viewing the video, then we would multiply the above metric with this conversion metric.
Revenue
Our revenue model is based on subscriptions and while we want our customers to renew their subscriptions forever, there will come a time when a customer will no longer renew their subscription. We want to get a sense of the Customer Lifetime Value (CLV), which is an estimate of the amount of profit a customer is likely to contribute to before churning. This metric is represented as a $x over t months. And it is best to measure this directly by calculating what each churned customer had spent over the time they were using our service and then averaging it out over the number of churned customers. Because we want to measure lifetime value and not lifetime revenue, it is not enough to just do this. At the very least we need to subtract the CAC (introduced above in the Acquisition metrics section). We can get more accurate measures if we subtract out the average cost of servicing a customer over their lifetime as well.
Photo by Micheile Henderson on Unsplash